Esplorate le profondità dei vostri dati.
Surfer è il software leader per la mappatura, la modellazione e l’analisi dati.
Permette di convertire i dati nei seguenti tipi di mappe: contour, 3D wireframe, vector, image, shaded relief, post, base.
La mappa può essere scelta tra quelle in archivio o creata miscelando gli elementi di diverse mappe; può essere poi personalizzata in tutti i suoi elementi al fine di arrivare al risultato desiderato.
Con Surfer la produzione di mappe di qualità è non è mai stata cosi veloce e semplice.
Adalta è Rivenditore Ufficiale e Importatore Diretto per l’Italia di Golden Surfer. Richiesta quotazione…
Manutenzione
A cosa serve Surfer?
Surfer helps engineers and scientists interpret complex geospatial datasets and transform them into insightful and understandable publication-ready models
Communicate with Confidence
You’re pressed for time with demanding clients, budget pressures, and an ever growing to-do list.
You’re also passionate about leveraging your expertise to find effective solutions to real world problems. Your challenge is communicating these solutions to both technical and non-technical people.
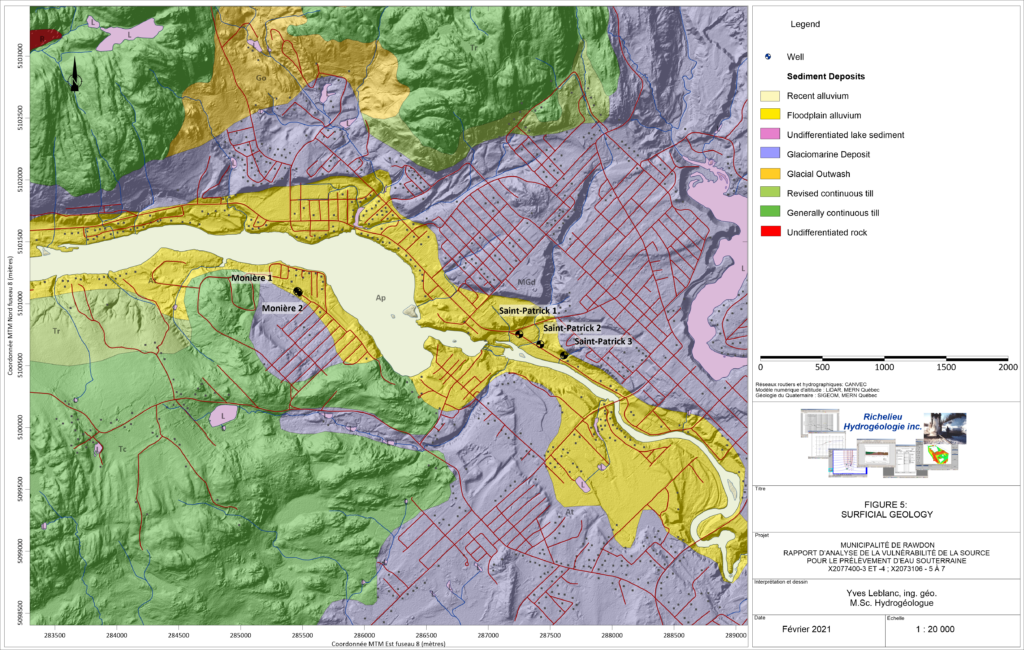
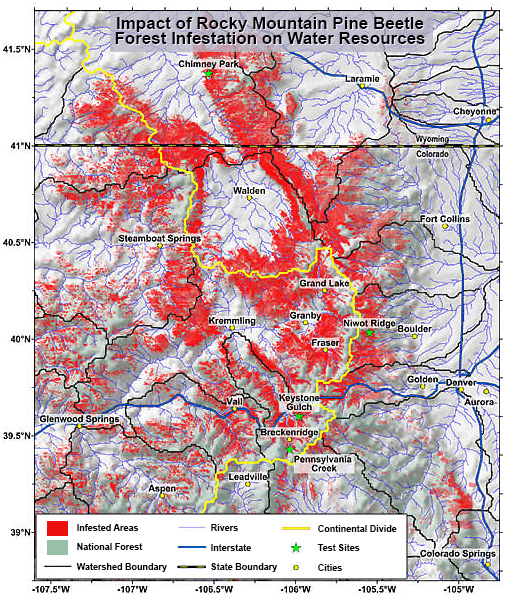
Whether you’re developing models for groundwater contamination, mineralization concentration, site suitability, potentiometric surfaces, or terrain analysis, Surfer helps you better understand the full extent of the site and communicate your findings to a broad range of audiences.
Effortlessly Manage Data to Save Time
How many times have you heard, “Yes, I have all the digital data for the site!” only to receive hundreds of unreferenced files?
You have the daunting task of transforming this information into something understandable from which to pull actionable insights.
Surfer offers a variety of tools to streamline the challenging data assembly process.
Complete Compatibility
Import and export numerous file formats like SHP, DXF, PDF, LAS/LAZ, and XLSX, georeference images, and effortlessly manage unreferenced data and data in different and multiple coordinate systems.
Robust Interpolation
Transform regularly or irregularly spaced XYZ or XYZC data onto a grid or raster with 12 different interpolation methods including Kriging, Inverse Distance to a Power, and Triangulation with Linear Interpolation.
Full Control
Each interpolation method provides complete control over all gridding parameters, including options to incorporate anisotropy, faults, breaklines, and variogram models.
New Insights
Incorporate old data into your model with Surfer’s georeferencing and digitizing tools and the option to generate grid or raster files directly from contour maps.
Enhanced Visuals
Visualize grids using 10 different map types such as contours or surfaces, and combine the data with other layers like aerial photographs, spot locations, drillhole data and LiDAR point clouds.
True 3D
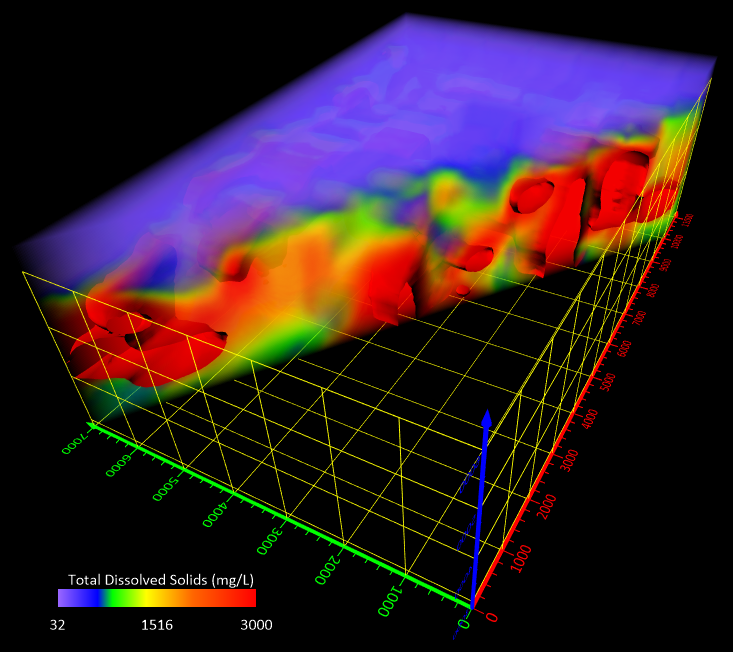
Level up your model with true 3D interpolation. Add point locations, surfaces, drillhole paths and data, and 3D XYZC grids as rendered volumes or isosurfaces in true 3D space.
Develop Eye-Opening Insights
Stakeholders rely on you to provide insights that save time, money, and headache.
Surfer empowers you with a robust set of analysis features.
Ensure Accuracy
Adjust interpolation and gridding parameters to ensure accuracy and increase confidence in the interpolated dataset. Include variogram models, define faults and breaklines, or generate grid statistics to identify trends or anomalies.
Reveal Insights
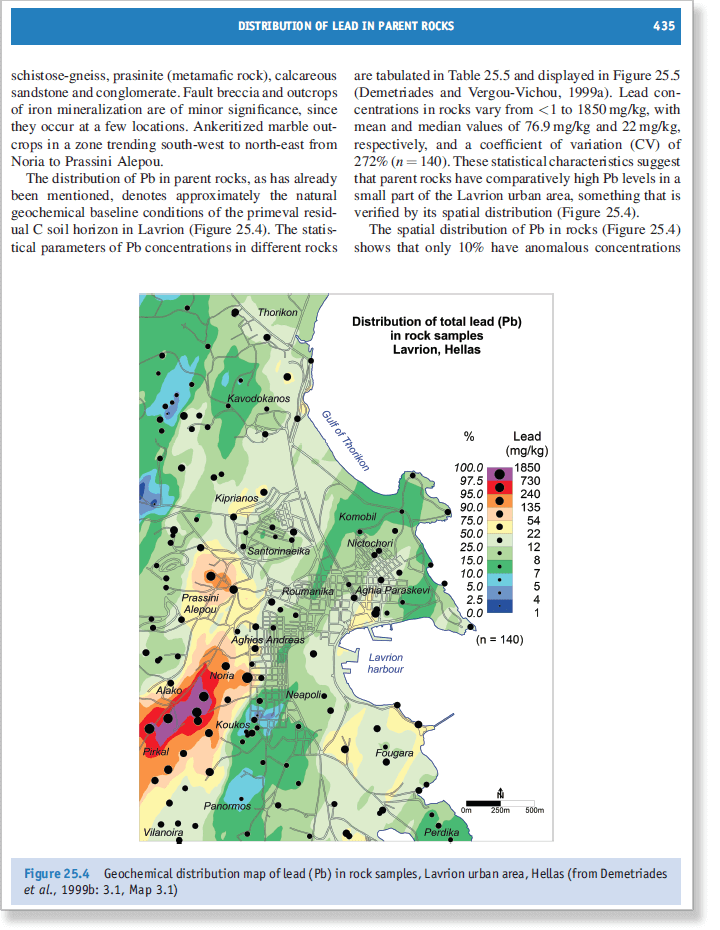
Apply mathematical operations on grid files, also known as matrix math. Generate isopach or isocore maps, calculate contamination volumes, identify anomalies, model groundwater flow and solute transports, or calculate slope, aspect, or curvature.
Eliminate Uncertainty
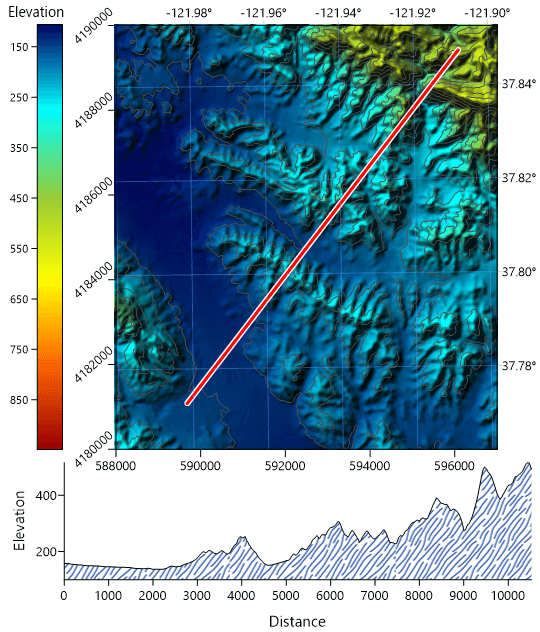
Bring subsurface characteristics to light with cross sections or profile maps or explore the data from every angle in Surfer’s 3D view as you fly between drillhole paths and inspect all aspects of isosurfaces and volumes.
Facilitate Understanding Across Audiences
There’s nothing better than seeing your work transform into something real and tangible. Surfer facilitates “AHA!” moments for technical and non-technical audiences alike.
You have full control of the final display. Practically every aspect of your Surfer model is customizable.
Enhance Maps & Models
Add title blocks, company logos, legends, scale bars, cross sections, magnifiers, or multiple axes. Add context with imagery that’s imported or downloaded from online servers directly within Surfer.
Share Your Work
Copy and paste directly into PowerPoint or Word, export all of some map layers to DXF for AutoCAD, provide the field crew with a KMZ file to view the model in Google Earth, or export to PDF, 3D PDF, or TIF for your final report.
Bridge the Gap
Help investors fully conceptualize the extent of the project by walking them through the site in 3D all from the comfort of the boardroom. Highlight areas of interest, pinpoint the source of contamination, and clarify the full extent of the remediation efforts.
Cosa c’è di nuovo in Surfer 29?
L’ultima versione di Surfer presenta numerose novità!
Le principali sono elencate di seguito.
A more complete list of the new features can be found here:
Top Features in Surfer’s Latest Release
Download Direct from Google Maps
Google Maps has now been integrated into our Base from Server command, along with other XYZ Tiles servers like OpenStreetMaps! No longer do you need to hunt for the right server to download imagery for your field area. Simply assign a coordinate system to your map, click to download a base map from the server, and select one of the Google servers. High quality, global imagery is at your fingertips!
Select to download base layers from Google Maps among other new available servers!
3D View: Drillhole Keywords
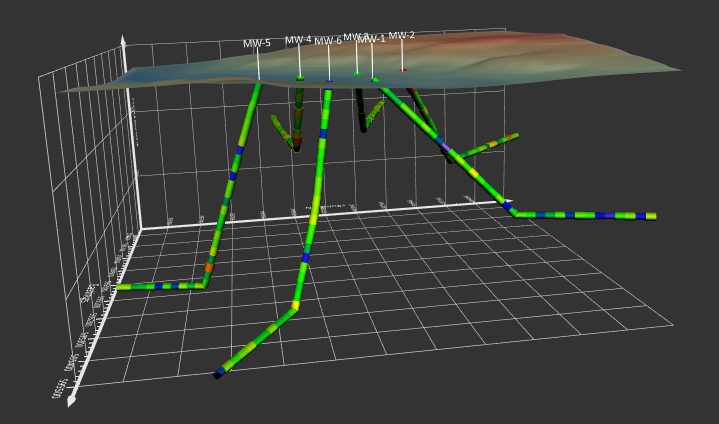
Apply color to the intervals in your 3D drillholes based on text keywords, like lithology name! This makes it easy to visualize stratigraphy, mineralization content, alteration zones, and formations in your 3D drillholes.
Simply include the text keyword for the intervals in your interval table and load it with any other drillhole data. Apply color to the intervals, based on the text keywords. You can also create a legend of the keywords, rearrange the order they are displayed in the legend, and even rename the keywords if you want the legend to show something other than the text keyword (e.g. SST => Sandstone).
Display colors based on text keywords (e.g. lithology) in 3D drillholes and create a legend with the corresponding colors and names.
3D View: Contour Slices
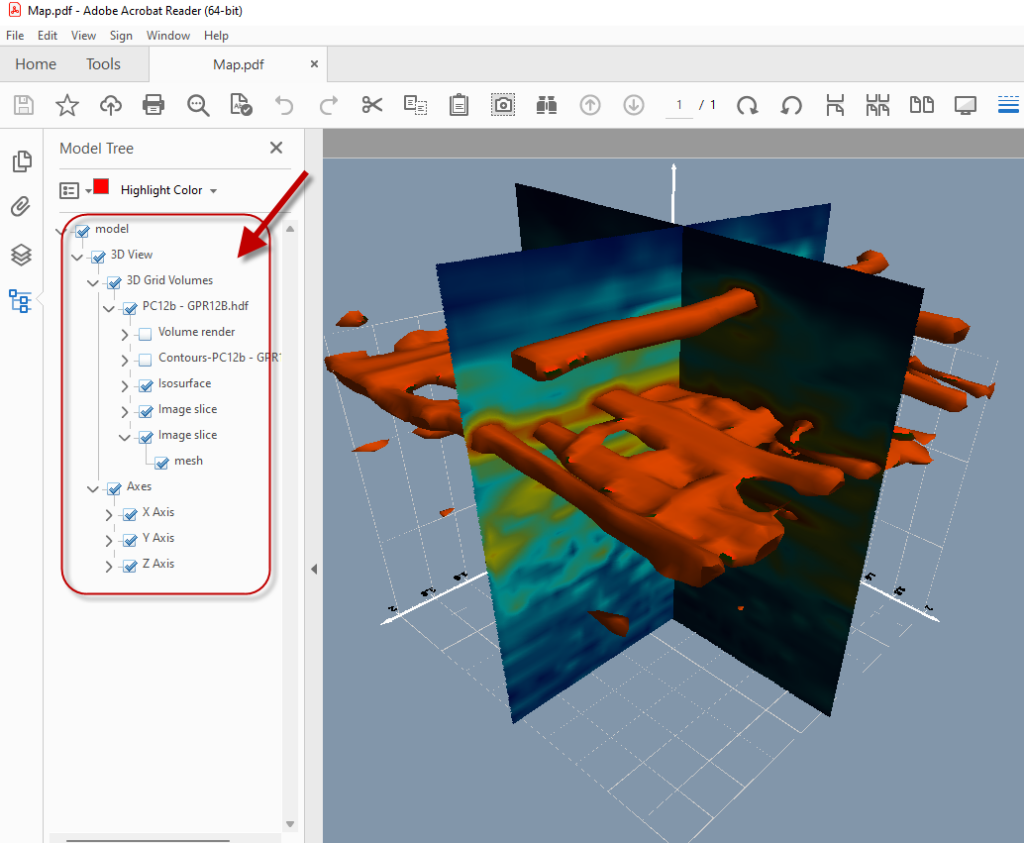
Add contour slices through a 3D grid in the 3D view. This can allow you to show contours along specific planes (e.g. on the edge of a clip plane or volume render) or at any specified orientation through your 3D grid. Use the same flexible and customizable contour properties that you can in the 2D view, such as contour labels, logarithmic contour intervals, and saving/loading LVL files to create just the contours you want to see.
Create models with multiple visualizations – model contaminant plume concentrations from one 3D grid as a volume render or isosurface, and hydraulic conductivity from a different 3D grid as contour slices! The options are endless…
Create contour slices through your 3D grid! Visualize with isosurfaces for a stunning effect!
Linked Text
Link text objects to show specific text like the date, the filename or filepath, or the contents of a specific cell in a worksheet.
This makes it easy to link text to cell contents in an Excel file, or insert the date the project is edited, or insert the filepath and filename so the information isn’t lost. You can easily refresh the text if anything changes and it will automatically update.
Insert text into title blocks and figures that automatically include the date, cell contents from a data file, filename or filepath. Refresh the text easily with a single click!
Updated March, 2025
Requisiti di sistema di Surfer
Surfer is a Windows based, desktop software.
For Mac, Linux, or Unix users, Surfer can be run using your preferred Windows emulator. We recommend testing the functionality with our trial version before purchasing.
Minimum requirements
- Windows 10, 11, or higher
- 64-bit operation system
- 1024×768 or higher monitor resolution with minimum 16-bit color depth
- 500 MB free hard disk space
- 512 MB RAM
- 3D View: Graphics supporting OpenGL v3.2 or later
System recommendations for best performance
- Windows 10, 11, or higher
- 64-bit operating system
- 500 GB or larger hard-drive with at least 25% disk space available, or higher
- 16 GB RAM, or higher
- 3D View: Graphics card (e.g. NVIDIA, AMD, etc)
Optional settings
- Gridding, contouring, and color relief operations, all of which are heavily computational, are processor reliant and are multi-threaded. In Surfer, you will find a setting at File | Options | General | Max number of processors to use. It should be set to use all cores.
- For gridding and contouring operations, CPU performance is important. The more cores the better.
- When working consistently with very large data files, more RAM is important.
- Turning off auto recovery can help performance in some cases. It is OFF by default, but it can be enabled at File | Options | General | Save auto recovery information.